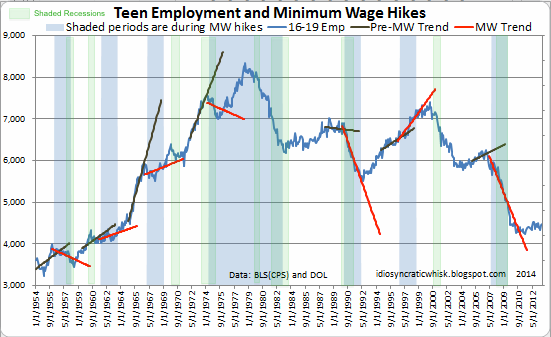
In January 2014, a funny thing seems to have happened. Parts (though not all) of the econoblogosphere forgot why time series econometrics fell out of favor in the early 1990s when it comes to analyzing minimum wage policies. Besides the fact that there is a lot more variation in minimum wages than just the federal (or average) minimum wage in the U.S., the timing of the minimum wage increases is very uneven. For example, U.S. minimum wage increases tend to occur more frequently during the late phases of the business cycle (see Figure 4).
Now this timing issue makes trouble even for state panel studies, but it really wreaks havoc on time series analysis. By not having a control group, time series evidence has to rely solely on changes in trends around the time of minimum wage increases, as this blog post by Kevin Erdmann most recently tries to do. In 6 out of the 7 episodes of minimum wages that he considers, employment trends slow down (or fall outright) following the minimum wage increases. In other words, the red post-MW trend lines have a smaller slope than the black pre-MW slopes.

It looks quite remarkable. Linking to this picture, Tyler Cowen quotes Erdmann: “Is there any other issue where the data conforms so strongly to basic economic intuition, and yet is widely written off as a coincidence?”
Well, here’s a reason why this evidence should be written off as a coincidence. Below, I overlay Erdmann’s graph with the NBER business cycle dates in light green. Why am I looking at this? Because if the post-MW period includes a recession and the pre-MW period does not, that will misattribute the recessionary job losses to minimum wages.
I hand drew the recessions in, and I’m not known for my fine motor skills. But I think you get the gist from the picture above. In 5 of the 6 events, the “post periods” used to fit the post-MW red trend line appear to include a downturn. (In other words, the red trend lines and green shadings overlap.) Now, we know very well that teen employment falls during a downturn. This tends to make the red post-MW trends smaller, providing a very simple explanation for why in 5 out of the 6 cases, the teen employment trend slowed down. And the 6th increase (in September 1961) happened right after the recession officially ended in February, so one could make an argument that the business cycle can help explain that one too.
Oh, and that 1 episode where the trend line actually rose after the minimum wage increase – which doesn’t fit the job loss explanation? That would be the minimum wage increase in the late 1990s boom, where the post-MW period does not appear to include a recession. In other words, business cycles can explain the pattern of employment trend changes in at least 6 out of the 7 episodes, and maybe even partly in the 7th.
Look – whether minimum wages cause teen employment to fall remains controversial. I think the clearest U.S. evidence comes from comparing across border counties with different minimum wages, using regional controls, or using synthetic control groups. All of these suggest the impact on teen employment is fairly small for the kind of minimum wage increases we have seen in this country. But whatever your position is on this question, you should probably steer clear of simple time series evidence that economists on both sides of the debate have wisely moved away from.

Leave a reply to Sloppy Economics and Part-Time Austrians | Gains from Trade Cancel reply