One of the features of the current labor market is that the usual mechanisms by which people find better quality jobs have broken down, as net job creation in manufacturing sector, larger establishments and more established firms—all of which tend to pay better—have fallen relatively more. A key avenue for mobility, transitions between jobs, took a dive with the onset of the Great Recession, and has not recovered. In a recent paper, Giuseppe Moscarini and Fabien Postel-Vinay call this the failure of the job ladder.
One of the consequences of a broken job ladder is that workers take—and stick around in—less than ideal jobs like fast food. But the failure of the job ladder does not impact all workers equally. Higher-credentialed workers have more opportunities to get some job—any job—than their lower-credentialed counterparts. A college graduate can get a job at McDonald’s if she wants to, but a high school grad will have a hard time getting a job in finance. So as the labor market is stuck in a low gear, an increasing share of fast food vacancies are filled with people who may not have taken such jobs in a healthy labor market, or may have climbed up the job ladder to better opportunities. This is a form of skills-mismatch, but one that is induced by demand conditions.
There are a lot of news stories and anecdotal evidence that support this argument. But is there hard evidence on how hiring patterns have responded in low-wage service jobs? To test this story, I went to one of my favorite data sources, the Quarterly Workforce Indicators (QWI). The QWI gives rich sectoral and demographic data on jobs and earnings at the state (or county) level. It is based on a near census of payroll employment that comes from employer filings for the Unemployment Insurance program. The Census Bureau then matches data from Social Security records and other sources to glean demographic information, before aggregating it by demographic and geographic cells. The QWI reports both employment counts, and also information on hires. This last part is important because sometimes it is easier to detect changes by looking at flows (hires) than stocks (employment.)
As a starting point, I plot the hiring trends for limited-service eating places (NAICS code 7222) which comprises of “establishments primarily engaged in providing food services where patrons generally order or select items and pay before eating.” These are what we colloquially call fast food restaurants. The QWI provides educational breakdown for hires, for those who are at least 25 years old. (It makes sense to exclude those who are usually too young to have a college degree.)
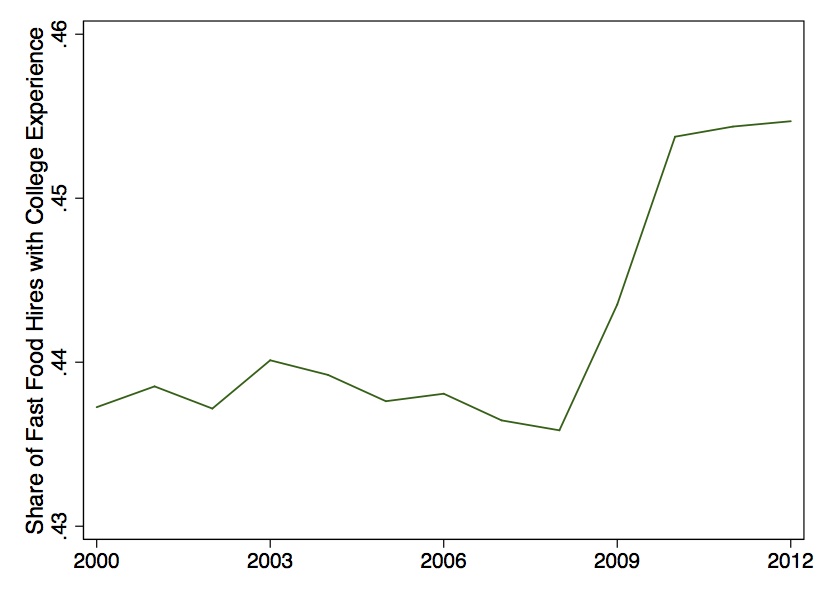
Between 2000 and 2007, the share of hires with at least some college experience (including associate or bachelor’s degree) clocked around 43.5%. However, it jumped up by 2 percentage points to 45.5% at the onset of the Great Recession and did not decline during the recovery through 2012q2 (latest QWI data available). While 2 percentage points may seem small, it is likely just the tip of the iceberg when it comes to the set of workers who are in these jobs only because of a weak labor market.
The pattern above suggests that overall joblessness nudged more higher-credentialed workers towards low-quality jobs, making it even harder for lower-credentialed workers to find jobs. Does this show up when we compare across different states? The answer is yes. To do this, I looked at the correlation between the higher-credentialed (some college experience) share of fast-food hires in a state and the quarterly state unemployment rate between 2000q1 and 2012q2, after de-meaning the data by state and time. (Actually very little changes if you don’t de-mean the data, but doing so provides a stronger test of the theory.)
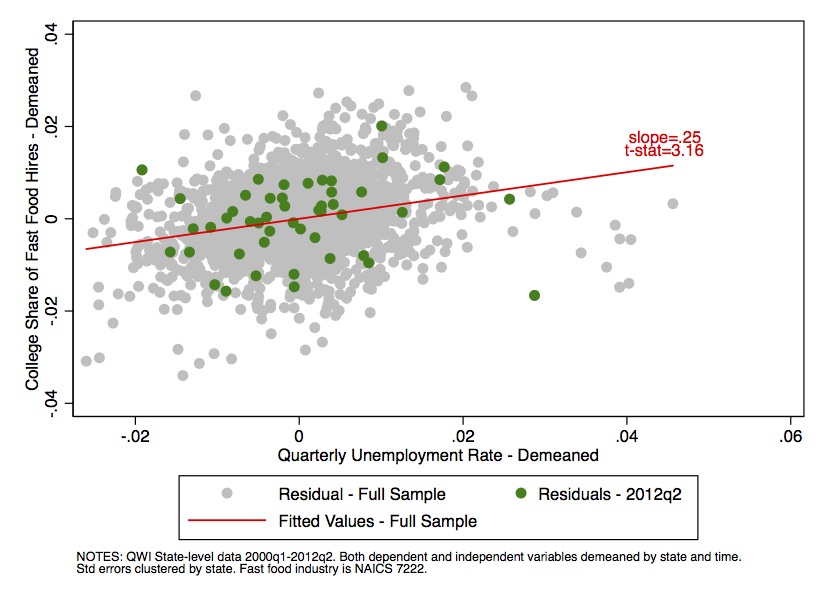
As the graph above shows, there is a strong relationship between overall unemployment rate in the state in a given quarter and the higher-credentialed share of fast food hires. The regression slope of 0.25 says a 5 percentage point increase in the unemployment rate is associated with a 1.3 percentage point gain in the higher-credentialed share of fast food hires. The relationship is highly statistically significant (at the 1 percent level). The cross sectional relationship and time series relationship match up fairly well—the regression estimate can rationalize most of the time-series change in the picture above. Similarly, the green colored markers show that the data points for 2012q2 follow a similar pattern as the full period.
Overall, the evidence suggests that we have a stock of misallocated workers in jobs due to weak demand. When hiring kicks into a higher gear, it won’t just be the new job creation for low-credentialed workers that will help reduce their unemployment rate. When the job ladder starts working again, it will also pull out over-qualified workers from fast food checkout counters which will help their lesser-credentialed counterparts. A final observation: if we want to understand what moves the low-wage service job share of employment for non-college-educated workers, it’s not just technology and polarization that matter; pulls and pushes due to labor market slack matter as well. While I am looking at somewhat different questions, Dean Baker recently made a similar argument as well.

Leave a comment